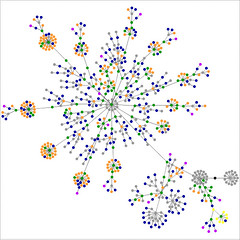
The image to the right is this site (clickthrough to watch it bloom!), as visualized as a graph by a guy in Zurich, who's also knocked together a funky mathematically driven art project that really skyrocketed today when Boing Boing got a hold of it.
Go 'head -- plug in your own URL »
Or see more funky lifeforms on Flickr »
Tuesday, May 30, 2006
Subscribe to:
Post Comments (Atom)


1 comment:
This reminds me of some data visualization things I've seen sprouting up in my field. They use thresholding and business rules to define the colors and the branching...but it essentially looks the same.
I heart boing boing, btw :-)
Post a Comment